Routing Production Failures Into Regression Test Suites
Catch LLM agent failures by tracing execution steps back to their root cause.
Traditional application monitoring measures latency, error codes, and uptime, and none of these metrics detect semantic failure in an LLM agent. None of those signals catch semantic failure, because nothing about a wrong answer looks abnormal to a dashboard built for uptime.
The deeper trouble is where the failure lives. Agent trajectories are long and language-heavy, full of reasoning steps, tool calls, and intermediate decisions, and the step where a failure becomes visible is very often not the step that caused it. A tool call three turns later might fail loudly while the actual mistake, a misread instruction or a hallucinated parameter, happened earlier and passed silently. A 2026 survey covering 55 papers published between early 2025 and April 2026 organizes this emerging research area along five dimensions: failure taxonomy, failure attribution, system enhancement and optimization, trajectory monitoring tools, and datasets and benchmarks TUM/ResearchGate Survey. That so much taxonomy was needed to even describe the problem space says something on its own: the tooling built for traditional software failure modes simply doesn't have categories for most of what goes wrong here.
The business stakes are not abstract. McKinsey's State of AI Trust report names security and risk concerns, knowledge and training gaps, and persistent weaknesses in strategy and governance as the leading reasons agent deployments stall out. None of those reasons are solved by better uptime metrics. They are solved, if they're solved at all, by an organization's ability to see what its agents actually did, understand why they went wrong, and stop the same failure from recurring. Non-determinism compounds the challenge further: re-running the same code against the same inputs won't reliably reproduce the failure. The usual incident-response loop of reproduce, patch, verify doesn't close the way it does for conventional bugs. That leaves an operational question the rest of this piece is built to answer: if the failure lives buried somewhere inside a long trace, how does an engineering team pull it out, pin down what caused it, and turn it into something that catches the same failure the next time it tries to happen? Agents return HTTP 200 even when they produce wrong answers, exhaust token budgets, or silently drift off-task.
Production trace contents and the detail gap that hinders failure localization
Agent observability, done properly, means capturing every step of execution: which tool got selected, what arguments it received, what the model said in response, what got read from or written to memory, how state transitioned, and which branch the agent chose at each decision point. That's a lot of surface area, and most existing instrumentation captures only a slice of it.
Four span types map cleanly onto four distinct failure modes, and a minimum viable schema needs at least one span type per mode. Tool spans record the tool name, arguments, raw output, duration, retry count, and error state; skip these and a hallucinated argument or a silent retry loop looks exactly like normal traffic. Reasoning spans capture the model's plan, the action chosen, the observation made, and the next decision reached, surfacing plan drift or wrong-branch selection that a single LLM span cannot show. Memory spans track reads and writes, what got retrieved and what got stored. Workflow spans track branching decisions, handoffs between agents or sub-processes, and loop counts.
The gap here isn't theoretical. TelemetrySuffBench, from Zhu and Pu at East China Normal University, tested exactly this and found that with full telemetry, origin-step Top-1 accuracy across five frontier models spans a range from 33.8% to 97.2%, a spread wide enough to expose the schema itself TelemetrySuffBench: Is Agent Telemetry Sufficient for Failure-Origin Diagnosis?. That's a schema problem wearing a model-capability costume.
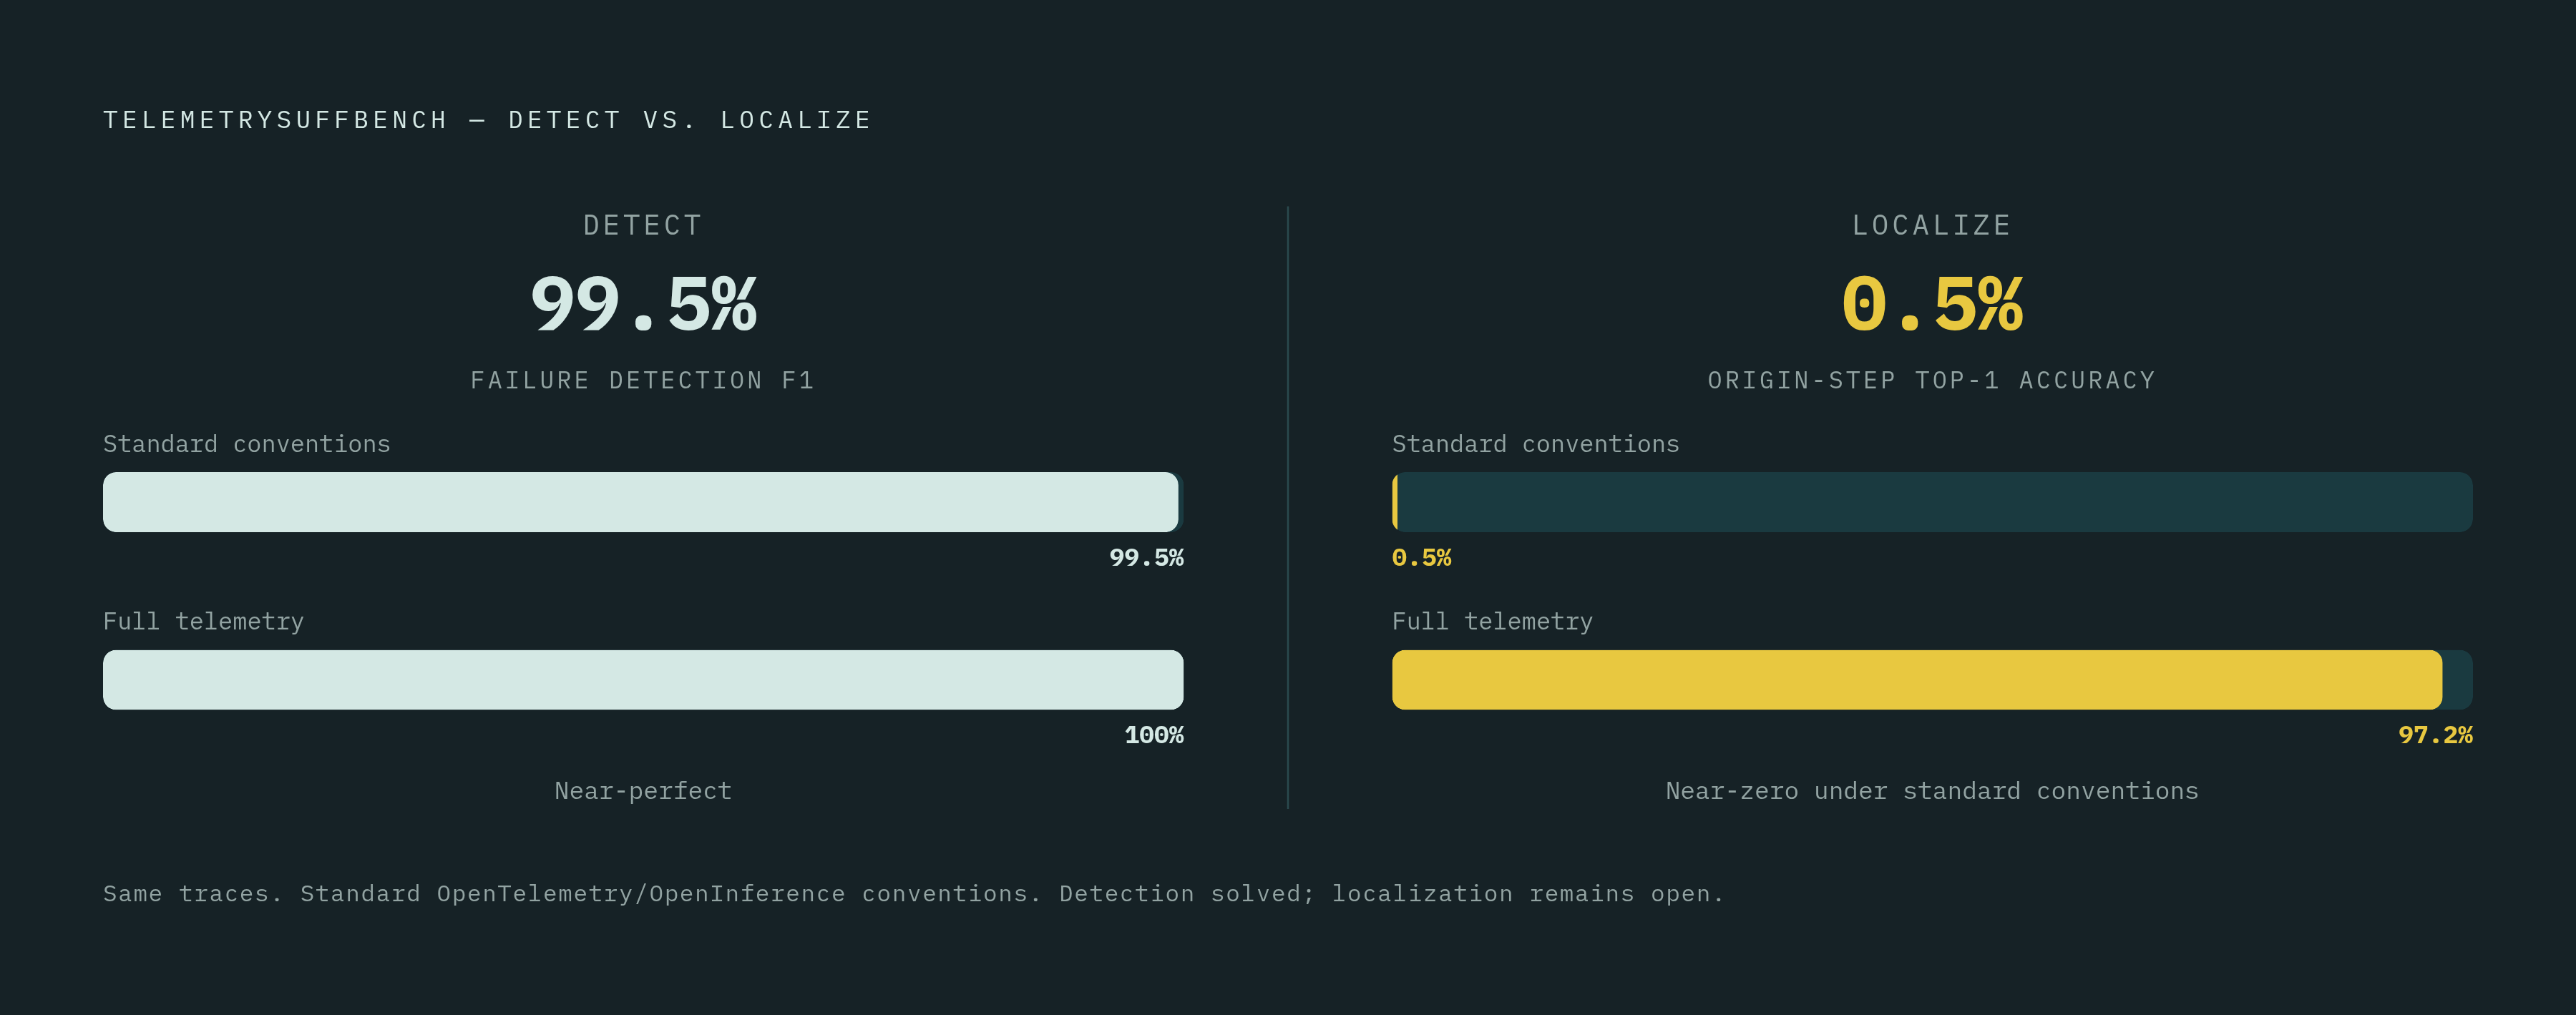
The same benchmark makes a sharper point still. Traces built to standard OpenTelemetry-compatible or OpenInference-compatible conventions retain detection F1 scores between 99.5% and 100%, are excellent at flagging that something went wrong, while limiting origin-step accuracy to at most 0.5% TelemetrySuffBench: Is Agent Telemetry Sufficient for Failure-Origin Diagnosis?. Detecting a failure and localizing its origin turn out to be almost entirely separable problems, and the observability conventions everyone already uses solve only the first one. Ablation tests in the same paper show why: strip out decision content and origin-step accuracy collapses to zero for every model tested, and strip out provenance, meaning which prior step or context an action drew from, and losses are large, though how large varies by model. Those two fields, decision content and provenance, are not optional extras. They separate a trace that can support debugging from one that can't, regardless of what analysis sits downstream of it.
Before building any routing pipeline, the sensible move is to audit existing instrumentation against those two fields specifically. A trace missing decision content or provenance links cannot support localization no matter how sophisticated the tooling reading it happens to be. On the tooling landscape itself: platforms that capture and replay traces are numerous, and Langfuse's acquisition by ClickHouse in January 2026 and IBM Instana's GenAI Observability launch in October 2025 are both signs of how fast this space has consolidated and expanded. But the localization gap sits at the schema and instrumentation layer, not at the choice of platform. Buying a better observability tool without fixing what gets logged into it changes nothing.
Failures hidden inside long trajectories, resistant to simple log review
Two structural features of long agent trajectories make eyeballing a transcript an unreliable way to find the causal step. The evidence needed to judge that a given step was erroneous may be scattered across distant instructions, observations, and prior context, so an erroneous decision can conflict with a task constraint stated at the very beginning. Second, failed trajectories rarely contain a single clean error. They contain multiple local errors that behave differently: some get repaired mid-run, some sit harmless and never matter, and only a subset actually contribute to the eventual failure. The critical error is often neither the first mistake in the log nor the one sitting closest, in time, to where things fell apart. A reviewer scanning chronologically for "the bug" is looking with the wrong instinct.
TRAJDEBUG, a framework from researchers at Tsinghua and Tencent, was built to address both problems directly. It uses multi-granularity history compression to make long trajectories tractable, then applies evidence-based error identification that flags "error triggers" as wrong commitments grounded in conflicts with task instructions, trajectory history, environment feedback, or the agent's own prior reasoning. From there it classifies error states, grouping related triggers into instances and tracking each instance's resolution status and eventual impact on the outcome. The framework was evaluated against TRAJERRBENCH, a set of 486 manually annotated failed trajectories drawn from τ²-Bench and SWE-Bench Pro, covering realistic tool-use and coding scenarios TRAJDEBUG: Tracing Error Lifecycle to Identify Critical Failures in Long-Horizon Agent Trajectories.
A related problem occurs specifically at scale. As execution logs stretch longer, LLM judges asked to perform root-cause analysis tend to settle on a plausible-sounding diagnosis early and leave critical evidence in the rest of the trace unexamined AgentDebugX: An Open-Source Toolkit for Failure Observability, Attribution, and Recovery in LLM Agents. This is a search failure, not a reading failure: the judge stops looking before it has looked far enough.
The clearest illustration of what that costs at real scale comes from the Hugging Face security incident in 2026 Root-Cause Attribution Is a Search Problem: Continual Search for Long-Horizon Agent Failures. Reconstructing the intrusion, which unfolded across a long agent-driven sequence, required analyzing more than 70,000 agent messages and files, and each fresh pass over the record turned up evidence that earlier passes had missed Root-Cause Attribution Is a Search Problem: Continual Search for Long-Horizon Agent Failures. That's a forensic burden that scales terribly without a systematic attribution process behind it. Locating the causal step in a long trajectory is a search problem through a large evidence space. It is not a reading problem, and that distinction is why the pipeline this article is building needs a dedicated attribution stage rather than relying on someone reading logs closely.
Attributing a failure to the specific harness layer that caused it
Root-cause attribution means assigning a failure to the component actually responsible for it: the model, the harness, the environment, or the grader. Four span types map to four distinct failure modes, and the minimum viable schema covers one span type per mode. That makes harness-level attribution the most operationally valuable target for a regression pipeline.
Anthropic's postmortem is the case study worth knowing in detail TUM/ResearchGate Survey. Claude Code's quality degraded, and the eventual explanation traced to three separate harness-level changes stacked on top of each other: a default downgrade in reasoning effort, a caching-optimization bug that quietly dropped thinking history every turn for the rest of a session, and a system prompt that limited verbosity too aggressively. None of the three were detectable as an obvious failure on their own. Each only became visible once someone traced the degradation down to the specific layer responsible, which is exactly the discipline this section argues for.
AgentDebugX formalizes a closed loop of Detect, Attribute, Recover, Rerun AgentDebugX: An Open-Source Toolkit for Failure Observability, Attribution, and Recovery in LLM Agents. Its attribution component, DeepDebug, performs multi-turn root-cause diagnosis through global trajectory understanding, structure-guided investigation, and cross-examination of competing hypotheses AgentDebugX: An Open-Source Toolkit for Failure Observability, Attribution, and Recovery in LLM Agents. On the Who&When benchmark, using a qwen3.5-9b backbone, it reaches 28.8% exact agent-and-step accuracy against 21.7% for the strongest single-pass baseline, and in a single rerun it repairs 13 of 73 failed GAIA tasks, compared to 4–6 for decoupled self-correction baselines AgentDebugX: An Open-Source Toolkit for Failure Observability, Attribution, and Recovery in LLM Agents. The gains are real but the absolute numbers are humble, a reminder that attribution accuracy is still an unsolved problem, not a solved one dressed up in confident tooling.
For scoping a regression case, a simple layer taxonomy helps: prompt-layer faults (instruction ambiguity, format drift, reasoning-effort defaults), tool-layer faults (schema drift, hallucinated arguments, silent retry loops, missing error states), workflow-layer faults (wrong-branch selection, loop conditions, handoff sequencing), and memory-layer faults (stale retrieval, context pollution, dropped thinking history). Continual Search, from Scale AI, shows that iterative attribution beats single-pass judgment by a wide margin: on MegaRCA-Mix, a set of 50 human-annotated long-horizon failure trials, it lifts GPT-5.5's F1 score from 0.349 to 0.498, a gain of more than 40%, simply by forcing the model to keep searching for evidence rather than accepting the first plausible answer Root-Cause Attribution Is a Search Problem: Continual Search for Long-Horizon Agent Failures AgentDebugX: An Open-Source Toolkit for Failure Observability, Attribution, and Recovery in LLM Agents. TelemetrySuffBench shows that evidence-gating, which refuses to answer without enough support, cuts unsupported unique-origin answers by 12.5 to 48.6 percentage points for three of the five models tested, but two of the five models answer every case regardless TelemetrySuffBench: Is Agent Telemetry Sufficient for Failure-Origin Diagnosis?. Abstention behavior is inconsistent across models, so a pipeline that trusts attribution blindly risks pinning the wrong layer with total confidence.
The output of the attribution stage should be a structured record containing a failure ID, the causal step index, the layer assigned, and the specific evidence fragments that support the call. That structure is what gets carried into the next stage, and prose diagnoses don't convert cleanly into test cases the way structured records do.
Converting an attributed failure trace into a pinned regression case
Non-determinism is the obstacle standing between an attributed trace and a usable regression test. Re-executing the entire original trace against a new build won't reliably reproduce the original failure, so a naive replay test can pass or fail for reasons unrelated to whether the fix actually worked.
Chronicle solves this with an operation it calls cut-point replay: capture the real interaction, then replay it against the new build while holding everything before the cut point fixed. Attribution identifies the causal step, and that step becomes the cut point. Everything upstream of it stays frozen, which isolates the component that changed and lets the test check cleanly if the fix resolves the original failure without dragging in unrelated noise.
A pinned regression case built this way needs to carry the original trace frozen at the causal step, the attributed layer and specific failure mode (a tool span with a hallucinated search-API argument, for instance), the inputs at that step held fixed for every future replay, the expected correct behavior expressed as something the suite can score programmatically, and the terminal outcome of the original run for end-to-end verification. That's five pieces of information, and skipping any one of them weakens the case's ability to catch a recurrence later TUM/ResearchGate Survey.
The case for production-sourced tests over hand-crafted synthetic ones gets concrete here. A trace pulled from a real production run carries partial context, ambiguous phrasing, odd formatting, missing permissions, tools that responded slowly, all the texture a synthetic case built from imagination tends to smooth over. TRAJDEBUG's TRAJERRBENCH, with its 486 manually annotated trajectories, shows how much annotation labor a synthetic benchmark demands to reach usable scale TRAJDEBUG: Tracing Error Lifecycle to Identify Critical Failures in Long-Horizon Agent Trajectories. A production-sourced case skips most of that cost, because the incident itself already labeled the failure. Regression suites built from these cases function as "goldens", a stable floor of behavior that must not slip below a defined threshold, and agents tend to degrade in ways nobody notices until a support queue starts filling up. The suite exists to catch that degradation before a customer does.
One distinction stands apart from the rest. When attribution points at model behavior rather than at the harness, the trace still has value as a known-bad case for monitoring purposes, but the fix path is different, since there's no harness change to make. Those cases should get tagged and routed apart from the harness-iteration queue rather than mixed into it.
Building the routing pipeline that connects live traffic to the regression suite automatically
The full pipeline runs in four stages, and each one is a discrete piece of engineering with its own way of breaking. Ingestion comes first: structured traces flow from the observability layer into a store that's queryable by span type, failure signal, and timestamp, and this only works if the decision-content and provenance fields from the schema discussion above are actually present. Surfacing comes next, where automated signal detection flags candidate failure traces using terminal task failure, tool retry exhaustion, plan-drift indicators, and token-budget overrun as signals. Not every anomaly is a genuine failure, so this stage needs a severity filter or it'll flood the rest of the pipeline with noise.
Attribution is stage three, where the structured attribution record gets produced for each surfaced candidate, using Continual Search-style iterative evidence gathering or TRAJDEBUG-style lifecycle tracing, depending on what the failure looks like. Registration is stage four: the attributed trace becomes a pinned case, added to the suite with its layer, failure mode, incident date, severity, and evaluator logic attached as metadata.
Between attribution and registration sits a human review gate, and it belongs there deliberately. Current attribution systems aren't accurate enough to auto-register without a person checking the call, and TelemetrySuffBench's finding that abstention behavior varies wildly across models shows why: a review gate stops a bad attribution from getting pinned permanently into the suite and quietly poisoning it.
Suite hygiene matters as much as suite growth. Duplicate cases covering the same failure mode and causal step should get clustered rather than left to pile up redundantly. Cases pinned to a harness configuration that no longer exists should get pruned, since a case tied to dead configuration just adds noise to every future run. Severity tiering keeps the important cases permanent: P0 failures, meaning task aborts or anything with a security consequence, get retained indefinitely, while lower-severity cases can be pruned once the responsible fix ships and passes its own replay validation.
The scale argument for automating all of this isn't hypothetical. Microsoft's Azure SRE Agent has handled more than 35,000 production incidents, cutting Azure App Service time-to-mitigation from 40.5 hours down to 3 minutes. At that volume, a manual routing process simply cannot keep pace, and treating the pipeline as a convenience rather than a scale requirement misreads what production agent traffic actually generates. The pipeline is a piece of software in its own right. It needs tests, version control, and someone on call for it, the same as any other production system, and treating it as disposable tooling rather than infrastructure is the mistake most teams make first.
Validating a fix against the regression suite before shipping it
Shipping a change to a prompt, a tool schema, or a workflow branch without replaying it against the known-failure suite is shipping blind. A fix aimed at one failure mode can resolve exactly that case while quietly introducing a new regression somewhere else in the same layer, and without a suite of pinned cases sitting behind the deploy, nobody will detect it until it recurs in production.
Chronicle's cut-point replay is the mechanism for closing that loop. Every pinned case in the suite gets replayed against the candidate build with its cut point held fixed, and the fix passes only if it resolves the original failure without breaking any of the other pinned cases sharing that layer. That's the entire point of building the pipeline described above: not a one-time incident report, but a suite that grows every time production breaks something new, so that the next change gets checked against everything the system has ever actually gotten wrong.
Sources
- TRAJDEBUG: Tracing Error Lifecycle to Identify Critical Failures in Long-Horizon Agent Trajectories
- Root-Cause Attribution Is a Search Problem: Continual Search for Long-Horizon Agent Failures
- TelemetrySuffBench: Is Agent Telemetry Sufficient for Failure-Origin Diagnosis?
- AgentDebugX: An Open-Source Toolkit for Failure Observability, Attribution, and Recovery in LLM Agents
- (PDF) A Survey for LLM Agent Trajectory Analysis: From Failure Attribution to Enhancement
- Chronicle: Cut-Point Replay for Regression Testing of LLM Agents Tisha Chawla*