Signal-to-Noise Ratio in High-Volume LLM Trace Streams
Filtering agent traces requires structural metadata, not just error counts.

Sources of structural noise in agent traces versus traditional service traces
Traditional application monitoring rests on three assumptions: the same input produces the same output, code paths are finite and known in advance, and a 200 response means the request succeeded. Agent systems break all three at once. A single user request might trigger several LLM calls, a handful of tool invocations, a vector database lookup, and a handoff between two or three sub-agents, and each of those steps is a place where things go sideways, invisible to a dashboard built to watch HTTP status codes.
Non-determinism makes this worse, not better. Running the same prompt twice can produce two different tool call sequences depending on temperature settings, what got pulled into context, or what's sitting in memory from a prior turn. The number of distinct span shapes worth tracking climbs fast, and filtering has to work across millions of operations rather than a few dozen known code paths.
The failures that matter most tend to be the quiet ones. An agent stuck in a loop looks perfectly healthy on an aggregate dashboard. A 200 response wraps around an answer that's confidently, completely wrong. Quality erodes for weeks before a user complains loud enough for someone to go looking. Aggregate error rate, the metric most teams still lean on, is close to useless here: it averages across every tenant and workflow, smooths over degradation on one specific connection or tool, and only counts the failures loud enough to throw an actual error code.
The noise comes from a few directions, and they compound. Retries that quietly succeed on the second try look identical to clean success. A latency spike on a throwaway retrieval step drowns out the one that actually matters somewhere else in the trace. Thousands of identical, boring, successful traces bury the one that's structurally different and worth a look. And when a sub-agent fails, that failure cascades, spawning error spans downstream in three or four other agents, only one of which is the actual cause.
Traditional logging captures discrete events. Agents need something closer to a causal chain: structured, typed spans that preserve the order and dependency of what actually happened. Without that structure, debugging an agent failure turns into guesswork dressed up as analysis.
The span hierarchy as the filtering primitive
A trace is a tree. Each span records one operation, stamped with a timestamp and linked to its parent. What's changed for LLM systems isn't the tree shape, but what fills the nodes: model calls and tool calls in place of HTTP handlers and database queries.
Standardization is catching up to the problem. A widely adopted set of semantic conventions for AI agents, released in 2025, defines shared attribute names like gen_ai.system, gen_ai.request.model, and gen_ai.usage.input_tokens. That common schema means traces coming out of different frameworks can land in the same pipeline without someone writing a custom parser for each one.
Four span types do the real work of exposing failure, and skipping any of them leaves a blind spot no filter downstream can fix. Tool-call spans capture the tool name, the arguments passed in, the raw output, duration, and retry count, and they expose hallucinated arguments or a tool quietly retrying itself into a loop. Reasoning spans record the plan, the action chosen, the observation that came back, and the next decision, surfacing plan drift or a wrong branch taken that a single isolated LLM call would never reveal. State transition spans capture working memory before and after each step, along with context edits and handoff payloads, catching the moment a long-running agent loses track of what it was doing. Memory operation spans record reads, writes, semantic search hits, retrieval scores, and freshness, exposing stale reads, wrong-entity retrieval, or memory bleeding between two different users.
These four are the actual surface that filtering operates on. They're the actual surface that filtering operates on. A trace missing one of them has an entire category of failure that simply can't be seen, no matter how good the filter logic turns out to be.
Tagging every span with business metadata (user ID, session ID, workflow ID) changes what's queryable. Without those tags, an engineer can replay one failing trace and study it in isolation. With them, that same engineer can ask "show every trace where tool X failed for users in segment Y over the last 48 hours" and get a pattern back instead of an anecdote. OpenTelemetry's four agent-specific span operations, create_agent, invoke_agent, invoke_workflow, and execute_tool, give that query a consistent shape to search against.
Where agent failures originate, what the taxonomy research shows
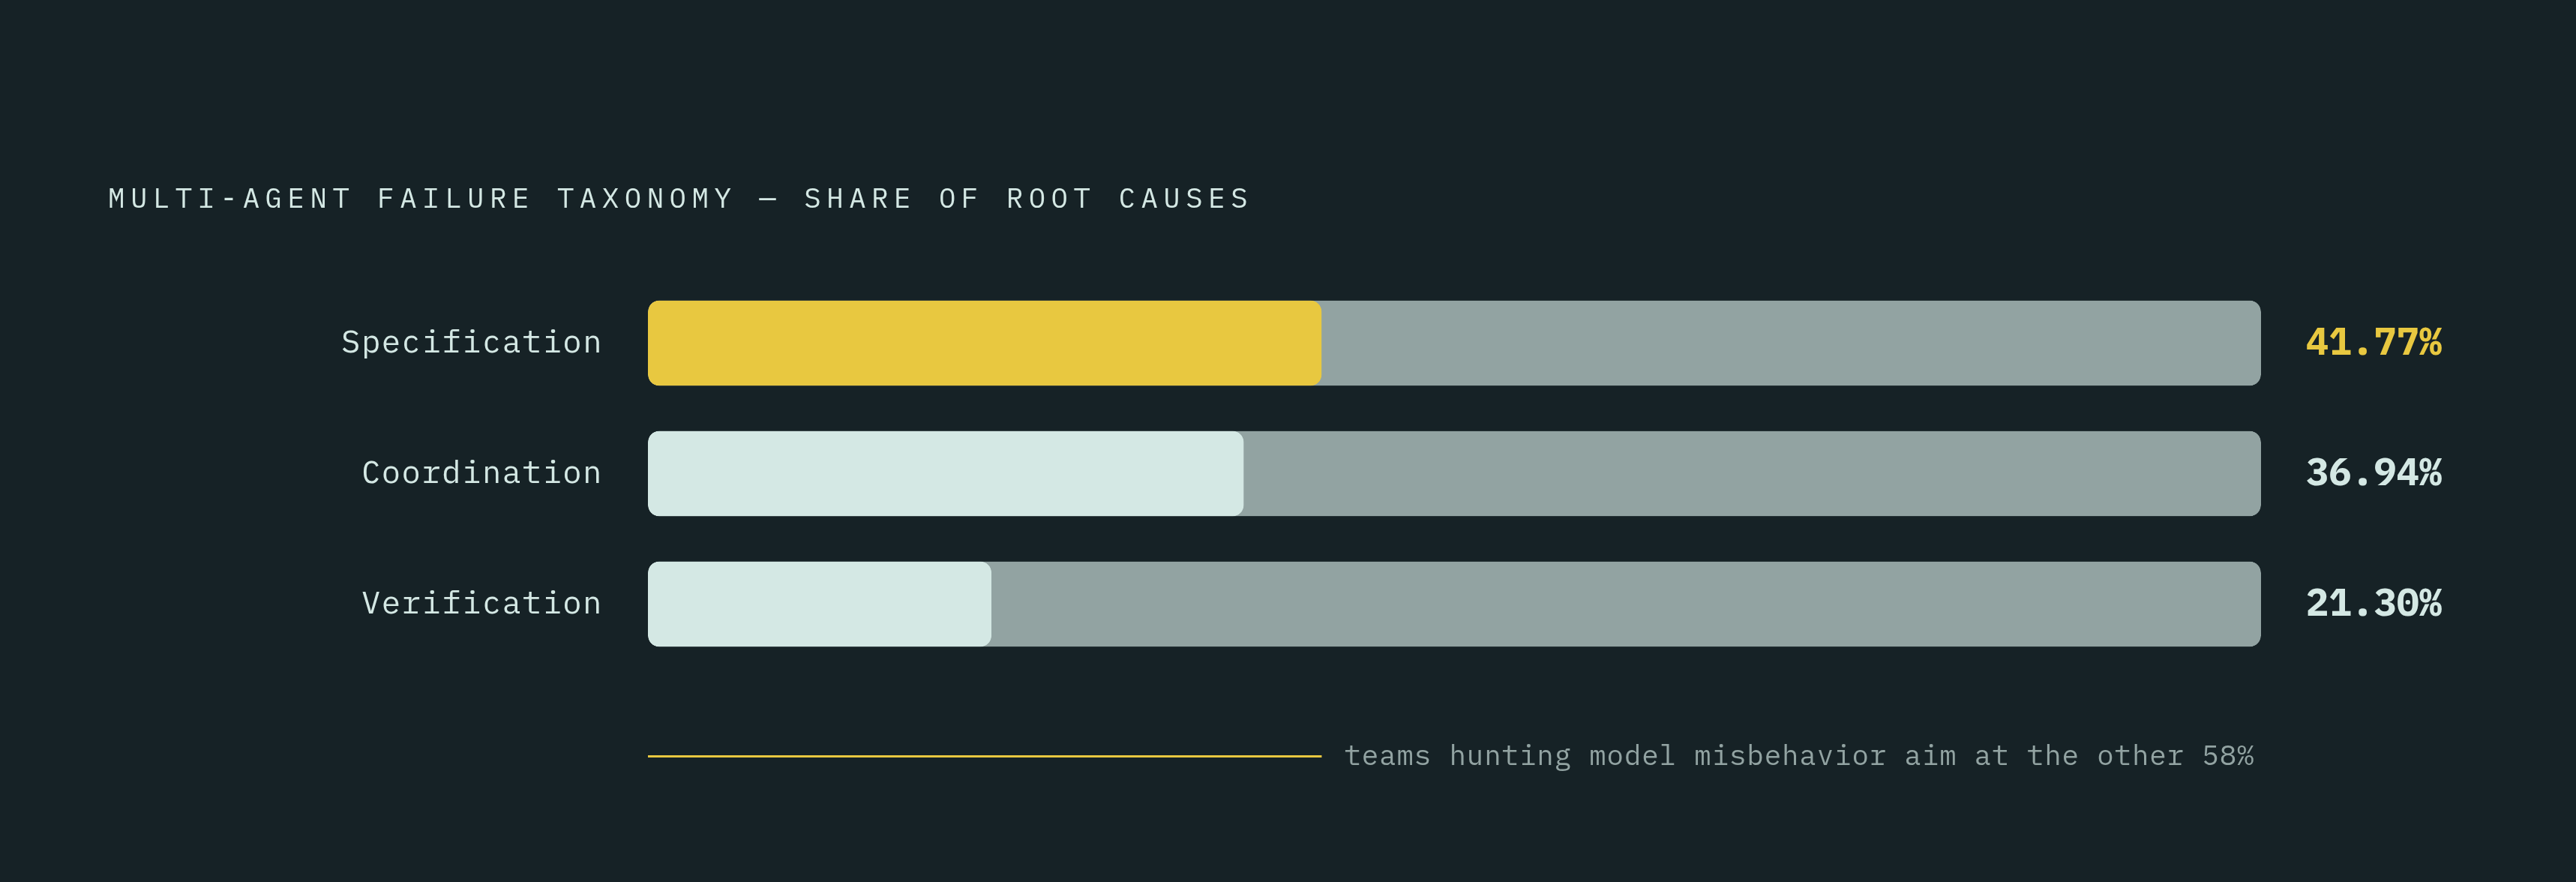
A taxonomy validated across a large corpus of execution traces sorts agent failures into three buckets. Specification problems (role ambiguity, unclear task definitions, missing constraints) account for 41.77%. Coordination failures (communication breakdowns between agents, state that never gets synced, objectives that quietly conflict) make up 36.94%. Verification gaps, meaning nobody built a check to catch the mistake, are 21.30%.
That first number is the one to sit with. The biggest bucket by far lives in the harness. Specification problems are prompt design failures and schema failures, the sort of thing an engineer fixes by rewriting a system message rather than retraining anything. Teams that spend their filtering budget hunting for model misbehavior are aiming at the wrong 58% of the problem. Filters tuned to catch harness-adjacent spans carry outsized value precisely because that's where most of the failures already sit.
A separate large-scale study takes a different cut, breaking agent execution into five operational modules: memory, reflection, planning, action, and system-level operations, producing what its authors call the AgentErrorTaxonomy. Regardless of which taxonomy a team adopts, the point holds: failures cluster by module, so a filter that ignores which module produced a span throws away the most useful signal it has.
Attribution is hard, and not for lack of trying. Natural language reasoning obscures root causes inside long execution trajectories, where a traditional software defect at least appears as a specific line of broken code. A recurring pattern in failed multi-agent tasks shows the trap clearly: in a web search task that comes back empty, the instinct is to blame the last agent in the chain, the one that reports "no results found." The actual root cause usually sits upstream, in the agent that formulated a search query too narrow to return anything useful.
Knowing which layer a failure lives in, tool, prompt, planning, or memory, is what turns a raw trace into something an engineer can act on. A count of errors by itself says nothing about where to look next.
How automated root-cause attribution performs today
The numbers on automated attribution aren't encouraging yet. The Who&When benchmark, built by researchers at Penn State, Duke, and Google DeepMind and presented as a Spotlight at ICML 2025, evaluated 127 multi-agent systems with detailed, hand-annotated failure records. The best method tested identified the responsible agent only 53.5% of the time. Pinning the exact step where things went wrong dropped to 14.2%. A few methods scored below what random guessing would produce.
LLM-as-judge approaches automate the process but pay for it in accuracy. On the TRAIL benchmark, the top-performing models reach a joint accuracy as low as 18.3%. On Who&When, the best existing methods locate the specific critical error step only 17.1% of the time. A more recent framework called AgentScope, published on arXiv by a multi-institution research team, found that GPT-5.1 used on its own for failure attribution scores just 18.15%, and that combining structured behavioral abstractions with LLM-guided reasoning beats either approach used alone.
A 2026 paper treating root-cause attribution as a search problem targets failure modes in LLM-as-judge approaches and proposes running the judge through several passes to improve coverage, evaluated across the TRAIL, TELBench, AgentRx, and Who&When benchmarks.
None of this is reliable enough yet to route a fix without a human checking the work. Automated attribution earns its keep narrowing a list of suspect spans down to a handful. Deciding which one actually caused the failure still needs an engineer looking at the evidence.
Principled filters for separating failure signal from trace noise
Filtering works best applied at three separate layers: structural, which looks at span type and where a span sits in the hierarchy; semantic, which looks at what's actually inside a span; and statistical, which looks at how a span deviates from a baseline built across a population of similar traces.
On the structural side, a scope filter drops spans belonging to traces that finished successfully, unless a child span somewhere in that trace carries an explicit error state. Most of the noise in a trace stream comes from clean runs generating volume nobody needs to read. A hierarchy filter walks the parent-child chain before assigning blame, because the span that reported the error is rarely the span that caused it. Routing by span type then sends failures to whoever can actually fix them: tool-call failures to whoever owns the tool schema, reasoning anomalies to whoever owns the prompt and planning logic, state transition failures to whoever owns memory and context handling.
Semantic filters look inside the span rather than at its shape. Comparing tool call arguments across a population of similar traces reveals structural drift, a missing required key, a type mismatch, even when the tool call technically returns a clean result. Scoring whether a reasoning span's plan still matches the user's original intent catches drift even when the downstream steps happen to succeed anyway. Flagging memory operations with retrieval scores under a calibrated threshold, or entries older than a defined freshness window, catches the specific failure mode that hits retrieval-heavy agents hardest.
Statistical filters are where aggregate error rate finally gets replaced with something useful. Build a separate baseline for each tool, workflow branch, and user segment, so the signal becomes deviation from that specific baseline rather than deviation from a blended average that hides everything interesting. Retry count on tool spans tends to move before the error rate does, making it one of the earliest available signs that a tool schema has drifted or an upstream API has changed shape. Combining behavioral monitoring with reasoning-level monitoring, rather than relying on behavioral signals alone, catches meaningfully more real problems.
Metadata is what makes all of this assignable rather than just interesting. Tag every span with workflow version, model version, tool schema version, and user segment, and a vague question like "find the failing traces" turns into a specific one: "find traces where tool X failed after schema version Y shipped." The version tag turns a signal into a root cause someone can go fix.
Building filters purely on whether the final answer was correct is a mistake. That signal arrives too late to matter, and it flattens every distinct upstream failure mode into one undifferentiated pile, so a team never learns whether the plan, the tool call, or the memory read was the actual culprit.
Routing filtered signals to the right layer for diagnosis
A framework out of the Chinese Academy of Sciences describes agent operations in four stages: monitoring, anomaly detection, root cause localization, and resolution. Filtering, as described above, sits inside anomaly detection. Routing is the bridge from localization to resolution, and it's the step most teams still get wrong.
The mapping is fairly direct once the failure's been localized. Specification failures, role ambiguity and missing constraints, belong to whoever owns the prompt and the harness, and the fix lives in the system message or the constraint logic. Argument hallucination and retry loops belong to whoever owns the tool schema, and the fix lives in the schema spec and its validation rules. Coordination failures and lost handoff payloads belong to the orchestration team, and the fix lives in routing logic and sub-agent boundaries. Stale retrieval and context loss belong to whoever manages the memory architecture, and the fix lives in freshness policy and retrieval thresholds.
Sending a failure to the wrong owner means the fix doesn't hold: the actual cause was never touched, and the engineering hours spent chasing it are gone for good. Automated attribution tops out around 53.5% at the agent level and drops to 14.2% at the step level, which means routing errors aren't an edge case. They're the default outcome without a structured filtering step in front of them.
Hierarchical trace models matter most in multi-agent pipelines, where a root cause in one sub-agent can propagate through several downstream steps before anyone notices. Without that hierarchical view, debugging defaults to staring at the last agent that complained, which is usually the wrong agent. Teams without coverage across all four span types can't route by layer, for the simple reason that they can't see the layers to begin with. That's the real cost of skipping instrumentation: not a missing dashboard, but a routing decision made blind.
Validating that a fix addressed the failure before shipping it
Identifying a failing span and patching the prompt, tool schema, or workflow around it isn't the same as fixing the failure. Skipping the step of replaying the change against the historical traces that originally surfaced the problem means a team ships a hypothesis rather than a verified fix. The patch might quiet the symptom span while the actual root cause keeps producing the failure, just further downstream where nobody's looking yet.
Traditional log-based debugging can't reproduce a failure that was non-deterministic to begin with. Span-based trace replay is close to a baseline requirement for teams running agents in production now.
Doing this properly takes a few things in place at once. A corpus of historical failing traces, tagged by failure mode and by which layer they belong to, needs to exist so the right test cases are on hand when a fix is ready. The fix needs the ability to re-run against those same traces, modified prompt, tool schema, or workflow component, without triggering a single live tool call or side effect in production. And a scoring layer needs to compare behavior before and after the fix on the exact same inputs, the real traces that surfaced the original failure, rather than a synthetic benchmark built after the fact to make the fix look good.
Skipping that step means the fix ships on faith. Given how unreliable automated attribution still is, that's not a foundation any team running agents at scale can afford to build on.